amateur radio
band condition
ham radio
high frequency
ionosphere
propagation
solar cycle
sun spots
very high frequency
9m2pju, aindex, amateuradio, aurora, contesting, DXCluster, dxing, foF2, geomagneticstorm, hamradio, hamradiocontest, hamradiodx, hfconditions, hfpropagation, ionosphere, kindex, propagation, QRZ, radiooperator, radioscience, RadioWaves, solarcycle, solarflux, sporadice, sunspots, vhfconditions, vhfpropagation
9M2PJU
0 Comments
How to Read Propagation Charts for HF and VHF DXing
Understanding propagation charts is essential for amateur radio operators who want to optimize their chances of making long-distance (DX) contacts. These charts provide crucial insights into solar activity, geomagnetic conditions, and expected signal performance across different bands. In this guide, we’ll break down the key elements of a propagation chart and how to interpret them for successful radio communication.
Key Propagation Metrics
Propagation charts contain several numerical and graphical data points that describe the current state of the ionosphere and space weather. Here’s what they mean:
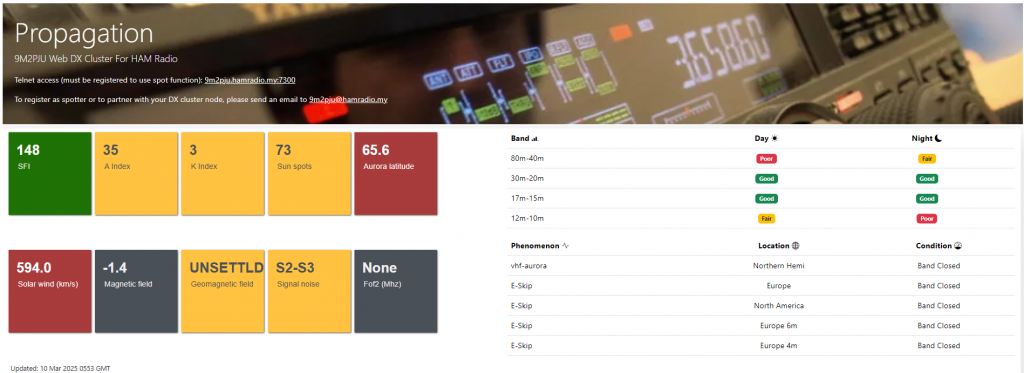
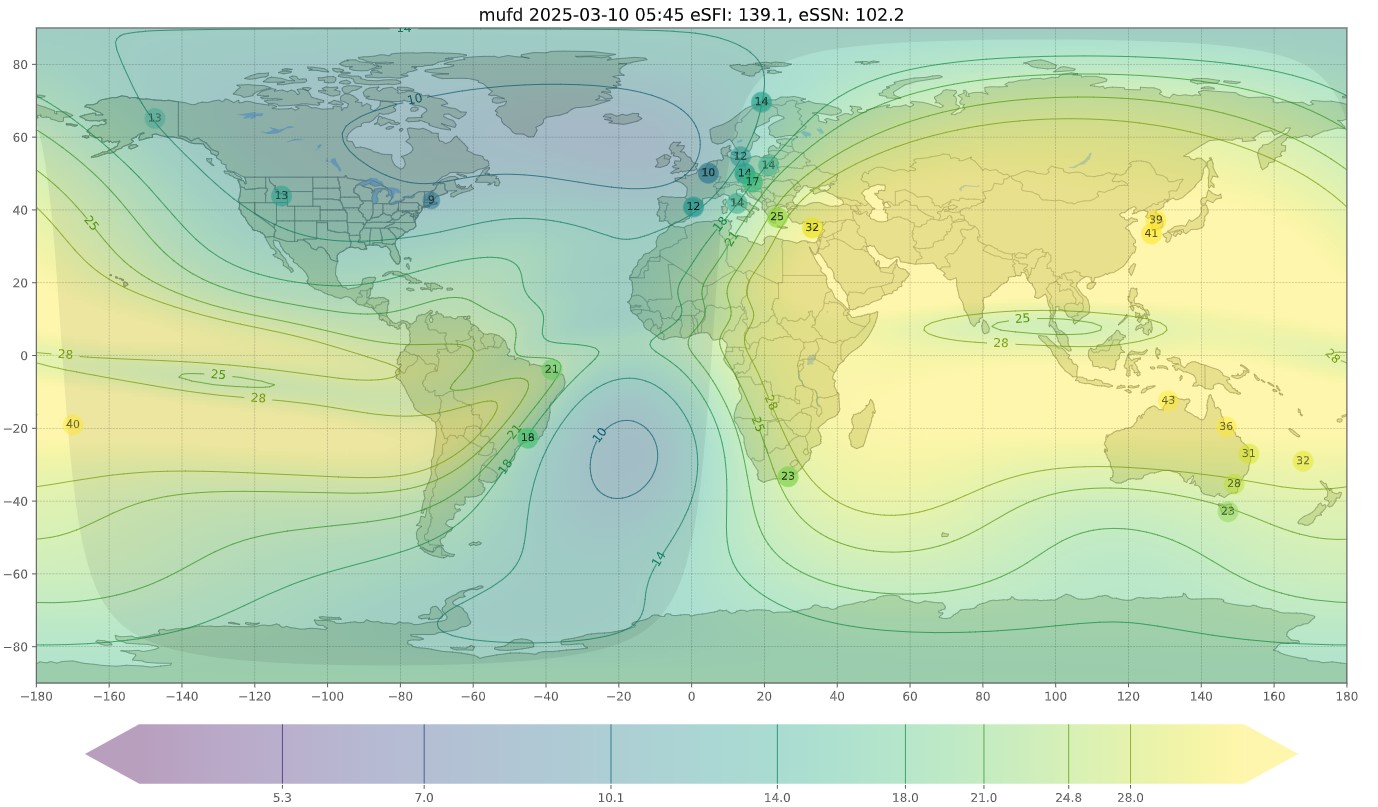
1. Solar Flux Index (SFI)
- The SFI measures solar radio noise at 10.7 cm (2800 MHz) and is a key indicator of ionospheric conditions.
- Higher values (above 100) generally indicate better propagation, particularly on higher HF bands (20m and above).
- Lower values (below 70) suggest weaker propagation, affecting high-frequency (HF) DX.
2. A Index
- The A Index represents geomagnetic stability over a 24-hour period.
- Values below 10 indicate quiet geomagnetic conditions, which are favorable for DXing.
- High values (above 30) suggest disturbed conditions that can cause signal absorption and fading.
3. K Index
- The K Index is a short-term (3-hour) measurement of geomagnetic activity.
- Values below 3 indicate stable conditions, while values above 5 suggest geomagnetic storms that can degrade HF propagation.
4. Sunspot Number
- More sunspots lead to increased ionization of the ionosphere, improving high-band HF propagation (10m, 12m, 15m, 17m).
- Low sunspot numbers typically mean poor conditions for high-band propagation but may favor low-band DXing (80m and 160m).
5. Auroral Latitude and Solar Wind
- Increased auroral activity (high auroral latitude) can cause signal absorption on HF bands but may enhance VHF propagation due to aurora scatter.
- Fast solar wind speeds (above 500 km/s) may signal disturbed conditions that affect HF performance.
6. Geomagnetic Field
- This tells us the overall stability of the Earth’s magnetic field.
- Quiet or Unsettled: Good for HF DXing.
- Active or Stormy: Poor conditions, increased signal absorption.
7. F2 Layer Critical Frequency (foF2)
- The foF2 value represents the highest frequency that the F2 layer of the ionosphere can reflect back to Earth.
- If foF2 is below 10 MHz, lower bands (40m, 80m) are more active.
- If foF2 is above 15 MHz, higher bands (20m, 17m, 15m) will likely be open.
How to Read Band Conditions
Propagation charts often provide a summary of HF band conditions during the day and night. Here’s how to interpret the table:
| Band | Daytime Conditions | Nighttime Conditions |
|---|---|---|
| 80m-40m | Poor | Fair |
| 30m-20m | Good | Good |
| 17m-15m | Good | Good |
| 12m-10m | Fair | Poor |
- Low bands (160m, 80m, 40m): Perform better at night due to reduced D-layer absorption.
- Mid bands (30m, 20m): Consistently good throughout the day and night.
- High bands (17m, 15m, 12m, 10m): More dependent on solar activity; better during daylight hours.
Special Phenomena
Propagation charts may also mention specific propagation modes:
- VHF Aurora: Enhanced VHF propagation due to ionized particles in the auroral zone. If active, 6m and 2m contacts over long distances may be possible.
- Sporadic E (Es): A seasonal phenomenon that allows short-skip propagation on VHF (6m, 4m, 2m). If the chart lists Es as active, expect openings on these bands.
Final Thoughts
By understanding these propagation metrics, you can better plan your radio activities and take advantage of favorable conditions. Keep an eye on daily updates to determine when and where DX opportunities are strongest.
For live updates, you can check the propagation charts at https://dx.hamradio.my/propagation.html and stay informed about band openings and real-time propagation reports.

Post Comment