E25VBE SDR Monitor Dashboard: Making Signal Reports Smarter and Simpler
In the world of amateur radio, spending a good chunk of time exchanging QRK/QST reports over the repeater just to explain how someone’s signal sounds. It’s useful, sure, but often inefficient. Enter E25VBE’s SDR Monitor Dashboard—a brilliant, real-world solution designed by a ham, for hams.
🎯 What Problem Does It Solve?
The idea for this project came when E25VBE noticed how much airtime fellow Thai hams spent trying to describe signal quality and audio clarity. So instead of using vague or subjective audio reports, he built a tool that quantifies signal quality in real time—and makes it easy for everyone to understand.
How? By turning SNR (Signal-to-Noise Ratio) data into musical notes.
Yes, musical notes.
🎼 Signal Quality as Music
At the heart of this dashboard is a clever audio system: after each transmission, the SDR Monitor plugin reads signal strength from SDR# and plays a musical beep. Each note corresponds to a level of SNR—starting from Do-Re-Mi for S1 to S9, and beyond into +20, +40, +60 dB ranges.
This was not just an experiment. It worked—saving hams airtime and helping them focus on the real conversation.
However, some hams (especially those without musical training) had trouble identifying tone differences. So E25VBE took it further.
📡 From Sound to Visual: Real-Time Graphs
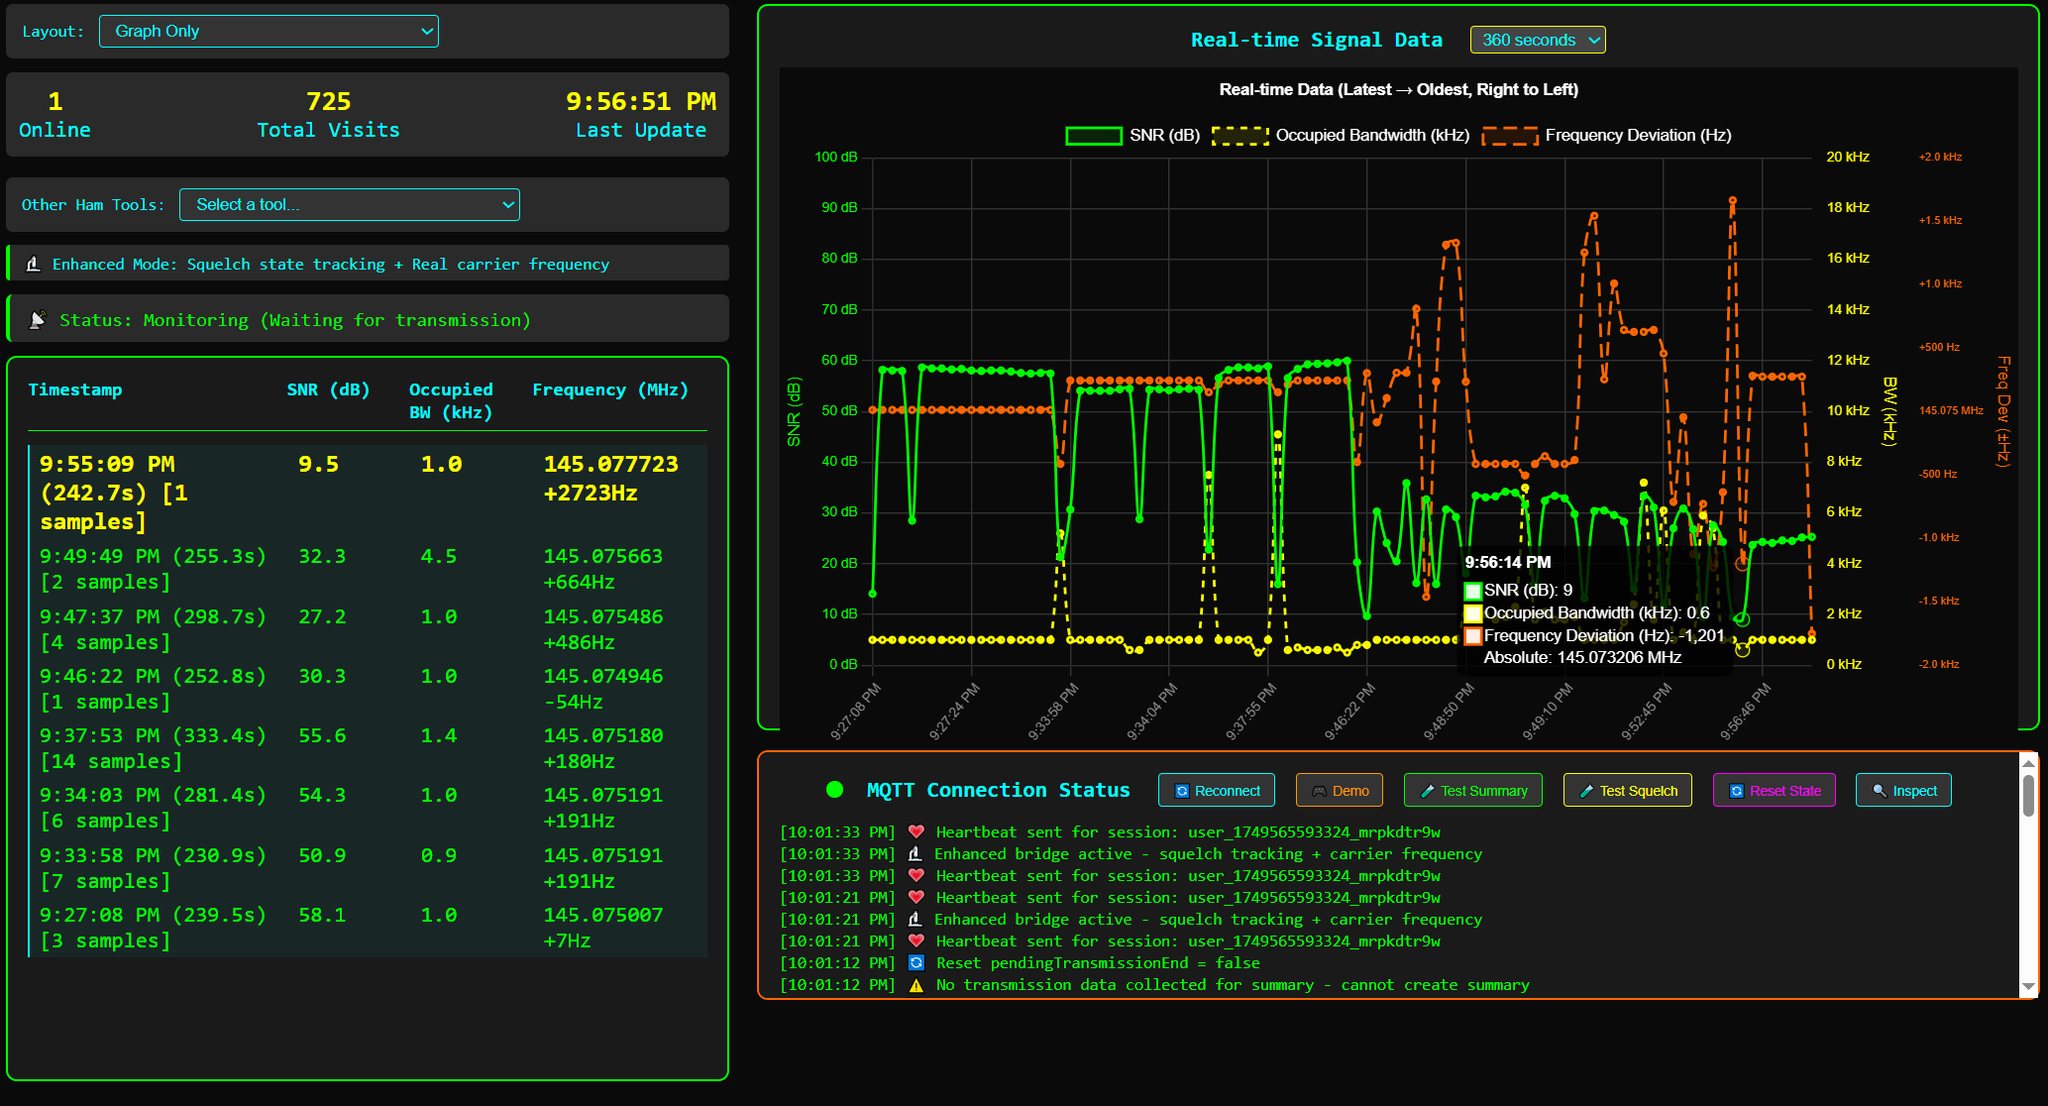
He started publishing the same SNR data over MQTT and built an HTML-based dashboard to visualize the signal. What began as a sound-based tool quickly evolved into a powerful visual platform to analyze:
- 📈 SNR (dB) — How strong is your signal?
- 🔊 Occupied Bandwidth — Is your modulation too wide or too narrow?
- 🎯 Frequency Deviation — Is your rig on frequency or drifting off?
And the dashboard works in real-time, providing graphs every few seconds. Whether you’re using a basic setup or an advanced station, this tool allows you to fine-tune your audio, power output, frequency accuracy, and even antenna direction.
🧪 More Than Just Monitoring
The SDR Monitor Dashboard has become a full-blown diagnostic tool. Here’s what else it offers:
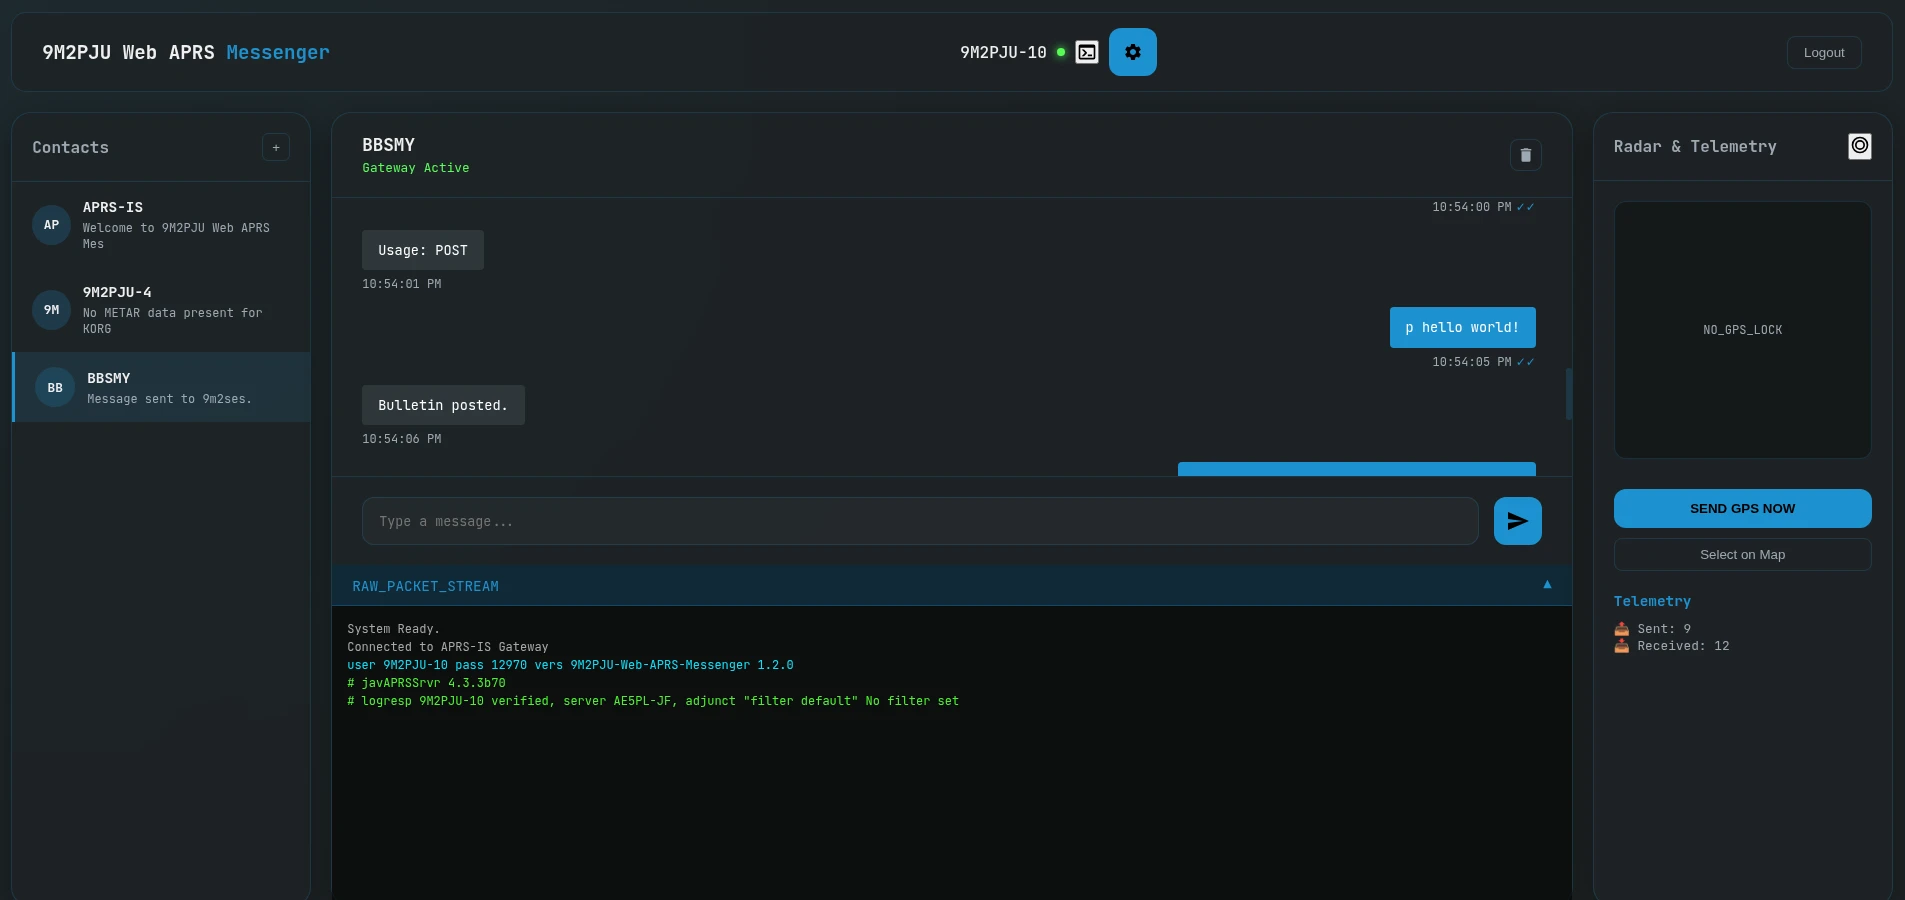
- 📍 GPS Location Logging – Pair your data with your station’s coordinates.
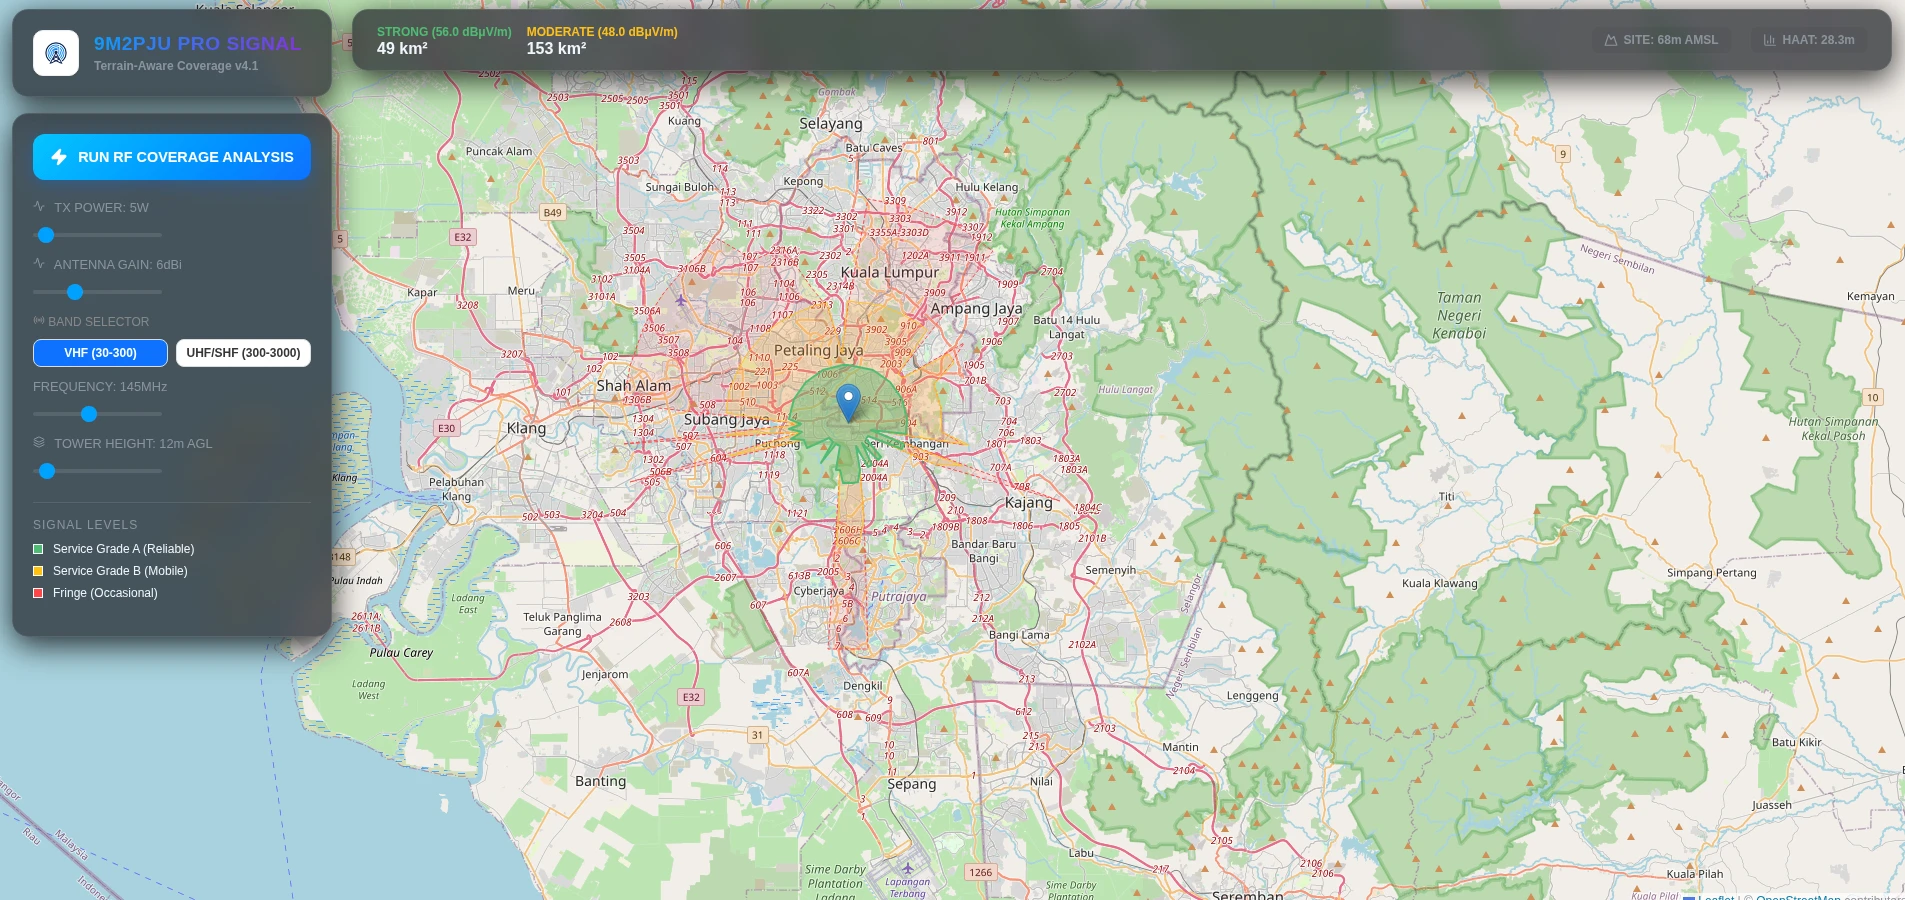
- 🗺️ Heatmap Mapping – See how far your signal travels and how strong it is across different areas.
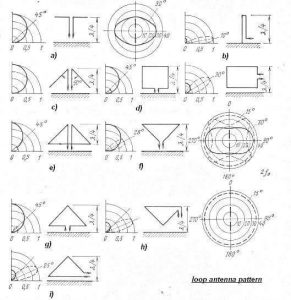
- 🔄 Antenna Rotation Visualization – Rotate your Yagi and watch the SNR graph paint your antenna’s radiation pattern.
- 📊 Field Test Comparison – Test different antennas (e.g., quarter-wave vs. NR22L) and compare results side by side.
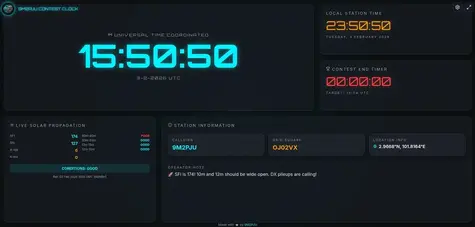
- 🏁 Contest Use – Six-month data retention allows verification of repeater QSOs during field day or contests.
🛠️ Precision Calibration for All
One of the standout features is the ability to analyze modulation width and carrier frequency deviation. Many hams unknowingly over-modulate their rigs or shift slightly off frequency—this tool gives them the equivalent of a spectrum analyzer to self-calibrate.
It’s particularly helpful in group environments where overdeviation can cause adjacent channel interference and even friction among friends. This tool encourages proper operating practices.
🌏 Open Tools for the Community
Although not all components of the SDR Monitor are open source, E25VBE has shared many key elements publicly. For example:
🔗 DADA1 – Directional Antenna Deployment Assistant: An open-source web tool to calculate azimuth and distance between two ham stations using location names, Maidenhead grid locators, or lat/lon coordinates.
He’s also developed a user and installation manual, available in both Thai and English, and set up a demo site at http://dada1.decem.co.th to help hams calculate beam headings and rotation angles and dashboard here https://e24cy.decem.co.th.
💬 Final Thoughts
This project is a fantastic example of how a passionate ham can take a real-world problem and turn it into a practical, technical, and user-friendly solution.
Whether you’re an everyday repeater user, a field-day operator, or just someone trying to fine-tune your antenna setup, the E24CY SDR Monitor Dashboard gives you the tools to do so with precision.
We highly recommend exploring the project if you’re interested in modernizing your repeater monitoring or signal analysis workflow. This is exactly the kind of innovation amateur radio needs right now.
📌 More info and updates: Facebook Group

Post Comment