How to Read a Smith Chart for Amateur Radio
Yes. I’d tighten it. The original is accurate overall, but a bit long and repeats a few ideas. Here is a more compact, easier-to-read professional version.
A Smith chart looks complicated at first, but for amateur radio it is mostly a visual way to understand antenna impedance. It helps you see not only whether your SWR is good or bad, but why it is good or bad.
An SWR meter may tell you, “The match is poor.”
A Smith chart can tell you, “The antenna is too capacitive,” “the resistance is too low,” or “the antenna is resonant but not 50 ohms.”
That makes it very useful when using an antenna analyzer, NanoVNA, tuner, matching network, or transmission line.
What the Smith Chart Shows
Most amateur radio systems use 50 ohms as the standard impedance.
The ideal point is:
50 + j0 ohmsThis means:
50 ohmsresistance0 ohmsreactance- SWR is
1.0:1 - the system is matched
On a Smith chart, this perfect match is at the center.
The goal is usually to get your antenna or load as close to the center as practical.
Understanding Impedance
Antenna impedance has two parts:
Z = R + jXWhere:
Z= impedanceR= resistanceX= reactancej= the imaginary/reactive part
Example:
50 + j0 ohmsThis is perfect for a 50-ohm radio system.
Another example:
35 - j20 ohmsThis means:
- resistance is
35 ohms - reactance is
-20 ohms - the antenna is capacitive
Another example:
70 + j30 ohmsThis means:
- resistance is
70 ohms - reactance is
+30 ohms - the antenna is inductive
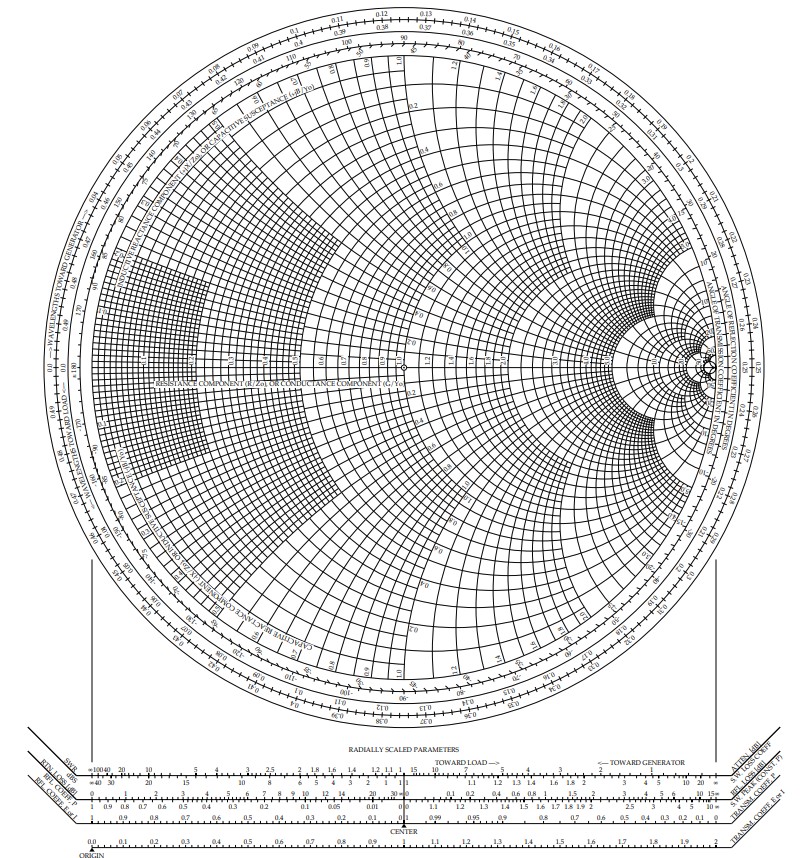
The Most Important Parts of the Smith Chart
Center
The center is the perfect match:
50 + j0 ohmsAt this point, SWR is 1.0:1.
Horizontal Line
The horizontal line through the middle is the zero reactance line.
If your point is on this line, the antenna is resonant.
But important:
Resonant does not always mean perfectly matched.For example:
25 + j0 ohmsis resonant, but it is not a perfect match to 50 ohms.
100 + j0 ohmsis also resonant, but still not a perfect match.
Only this is both resonant and matched:
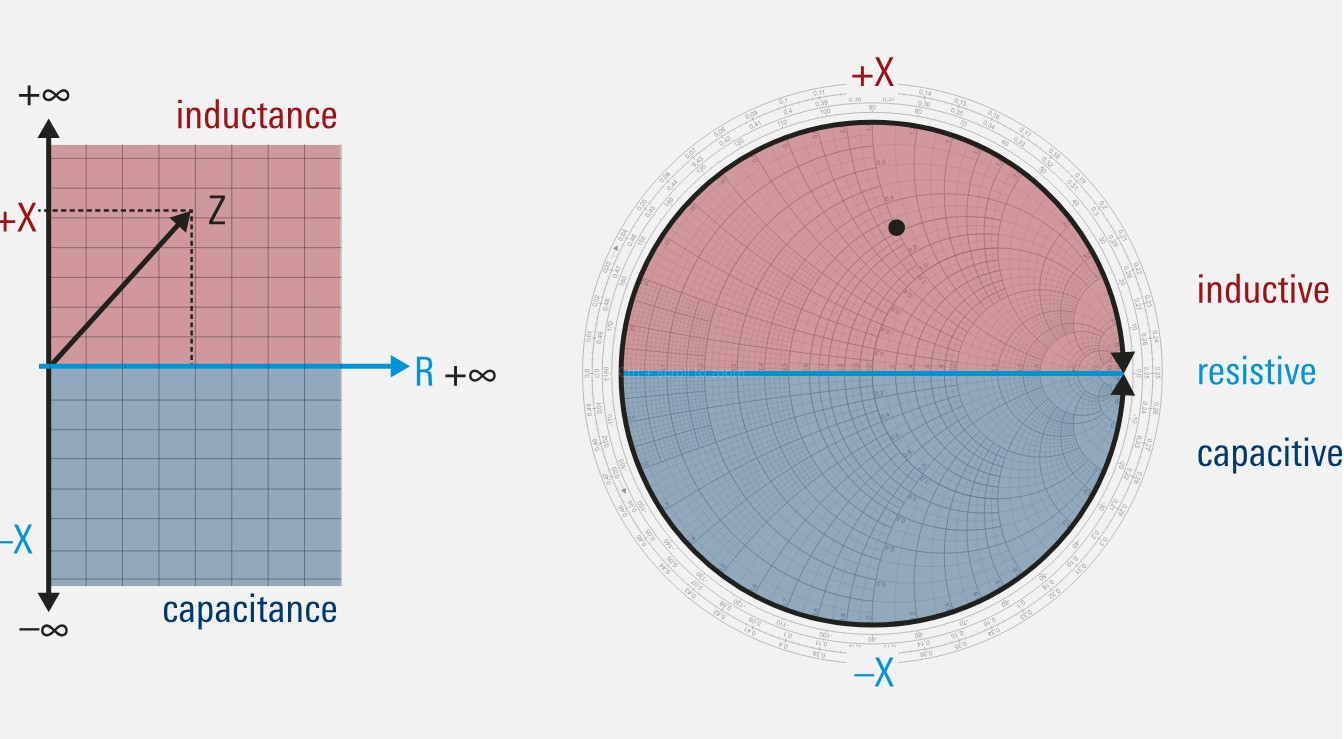
50 + j0 ohmsUpper Half
The upper half of the Smith chart is inductive.
That means positive reactance:
+jXExample:
50 + j30 ohmsFor many antennas, inductive often means the antenna is electrically too long at that frequency.
Lower Half
The lower half of the Smith chart is capacitive.
That means negative reactance:
-jXExample:
50 - j30 ohmsFor many antennas, capacitive often means the antenna is electrically too short at that frequency.
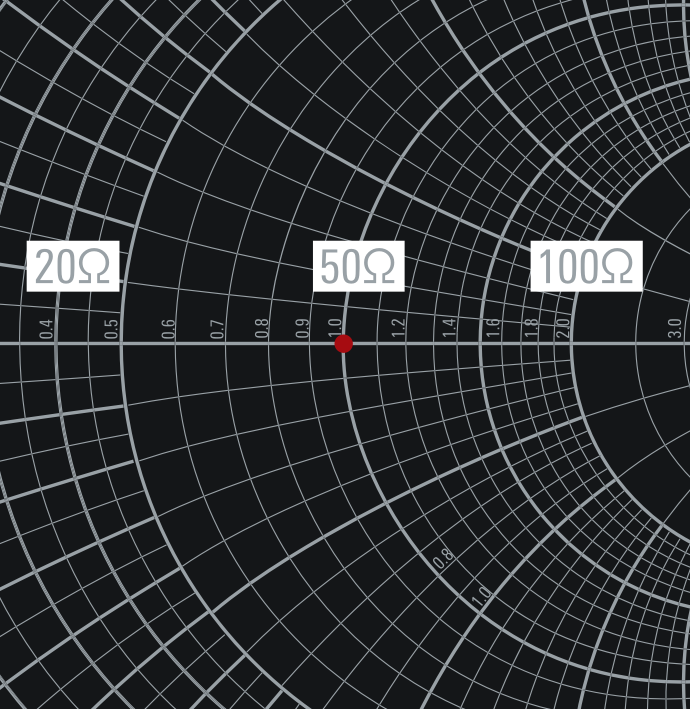
Left Side
The left side means resistance is lower than 50 ohms.
Example:
25 + j0 ohmsRight Side
The right side means resistance is higher than 50 ohms.
Example:
100 + j0 ohmsOuter Edge
The outer edge means a very bad match.
At the edge, reflection is very high and SWR is extremely high.
Quick Reading Rule
Use this simple guide:
| Smith Chart Position | Meaning |
|---|---|
| Center | Perfect 50-ohm match |
| Above center | Inductive |
| Below center | Capacitive |
| On horizontal line | Resonant |
| Left of center | Resistance below 50 ohms |
| Right of center | Resistance above 50 ohms |
| Near outer edge | Very poor match |
This is the main skill. If you know this table, you can already read the most important information from a Smith chart.
SWR on the Smith Chart
SWR is shown by distance from the center.
- Near the center = low SWR
- Far from the center = high SWR
- Outer edge = extremely high SWR
Many different impedances can have the same SWR. That is why a Smith chart is better than an SWR meter alone.
For example, these are different problems:
25 + j0 ohms
100 + j0 ohms
50 + j40 ohms
50 - j40 ohms
An SWR meter may show mismatch for all of them, but the Smith chart shows what kind of mismatch it is.
Resonance vs Good Match
This is one of the most important lessons.
Resonance means:
Reactance = 0The impedance is on the horizontal line.
Good match means:
Impedance is close to 50 + j0 ohmsThe impedance is near the center.
So an antenna can be resonant but still have high SWR.
Example:
30 + j0 ohmsThis antenna is resonant, but not perfectly matched to a 50-ohm radio.
How to Read a VNA Smith Chart Step by Step
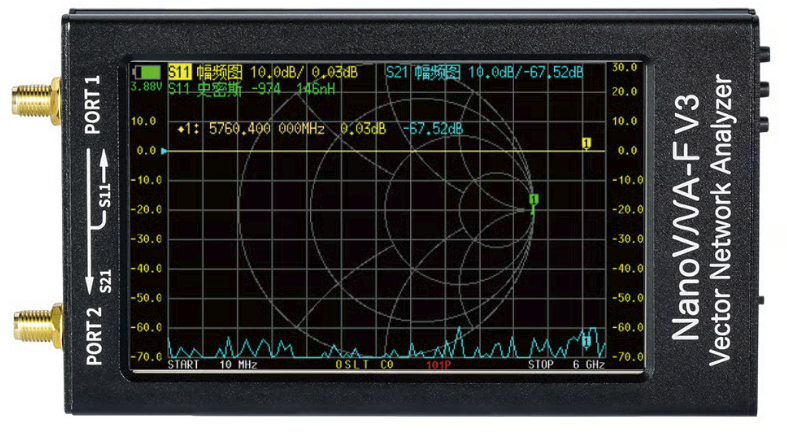
When using a NanoVNA or antenna analyzer:
- Set the frequency range.
- Calibrate the VNA properly.
- Connect the antenna or device.
- Display the Smith chart.
- Place a marker on the frequency you care about.
- Read the impedance value.
- Look at the marker position.
Then ask:
Is it near the center?
Is it above or below the line?
Is it left or right of center?
Is it on the horizontal line?
Example:
Z = 38 - j22 ohmsThis means:
- resistance is lower than 50 ohms
- reactance is capacitive
- the antenna may be electrically short
- the match is not perfect
Another example:
Z = 52 + j3 ohmsThis is very close to ideal. It should have a low SWR.
Tuning an Antenna with a Smith Chart
For many simple antennas:
Below the line = capacitive = often too short
Above the line = inductive = often too long
So if your antenna is below the line at your desired frequency, it may need to be longer.
If it is above the line, it may need to be shorter.
Example:
14.200 MHz: 42 - j25 ohmsThis is capacitive. The antenna may be too short.
Example:
14.200 MHz: 48 + j30 ohmsThis is inductive. The antenna may be too long.
This rule is useful, but not perfect. Coax length, nearby objects, ground conditions, traps, coils, and matching networks can change the reading.
Transmission Line Warning
Coax can transform impedance.
That means the impedance you measure at the radio end of the coax may not be the same as the impedance at the antenna feed point.
This is why VNA calibration matters.
For best results, calibrate at the point where you want the measurement to be accurate. If you want to know the antenna feed point impedance, calibrate at the antenna end of the coax or use proper port extension/de-embedding.
Matching Networks
A matching network moves the impedance toward the center of the chart.
Common matching tools include:
- antenna tuner
- series capacitor
- series inductor
- shunt capacitor
- shunt inductor
- transformer
- matching stub
- transmission line section
Simple idea:
The antenna gives you a point on the chart.
The matching network moves that point toward the center.
That is what a tuner is doing: transforming the impedance so the radio sees something closer to 50 + j0 ohms.
Practical Example: 2 Meter Antenna
Suppose your analyzer shows:
144 MHz: 40 - j20 ohms
145 MHz: 46 - j8 ohms
146 MHz: 50 + j0 ohms
147 MHz: 55 + j10 ohms
148 MHz: 62 + j25 ohms
This tells you:
- At
144 MHz, the antenna is capacitive. - At
146 MHz, it is close to perfect. - At
148 MHz, it is inductive.
So the antenna is tuned around 146 MHz.
On the Smith chart, the trace would move from below the center line, pass near the center, then move above the center line as frequency increases.
Common Mistakes
Do not assume low SWR means a good antenna. A dummy load has excellent SWR but does not radiate useful signal.
Do not assume resonance means perfect match. Resonance only means reactance is zero.
Do not trust VNA readings without calibration.
Do not forget that coax can change what you see.
Do not tune antenna length when the real problem is resistance, ground loss, or feed point design.
Simple Memory Guide
Remember this:
Center = best match
Up = inductive
Down = capacitive
Left = low resistance
Right = high resistance
Horizontal line = resonance
Far from center = higher SWR
That is enough to make the Smith chart useful for everyday amateur radio.
Conclusion
A Smith chart is a map of impedance. For amateur radio, it helps you understand antennas much better than SWR alone.
The center of the chart is the goal: 50 + j0 ohms. The upper half is inductive, the lower half is capacitive, the left side is lower resistance, and the right side is higher resistance. The farther your reading is from the center, the worse the match usually is.
Once you understand these basics, a Smith chart becomes much less intimidating. It becomes a practical tool for tuning antennas, reading NanoVNA results, understanding feedline effects, and building better matching networks.

Post Comment