Serial Studio: Open Source Telemetry Dashboard for Arduino, ESP32, and Ham Benches
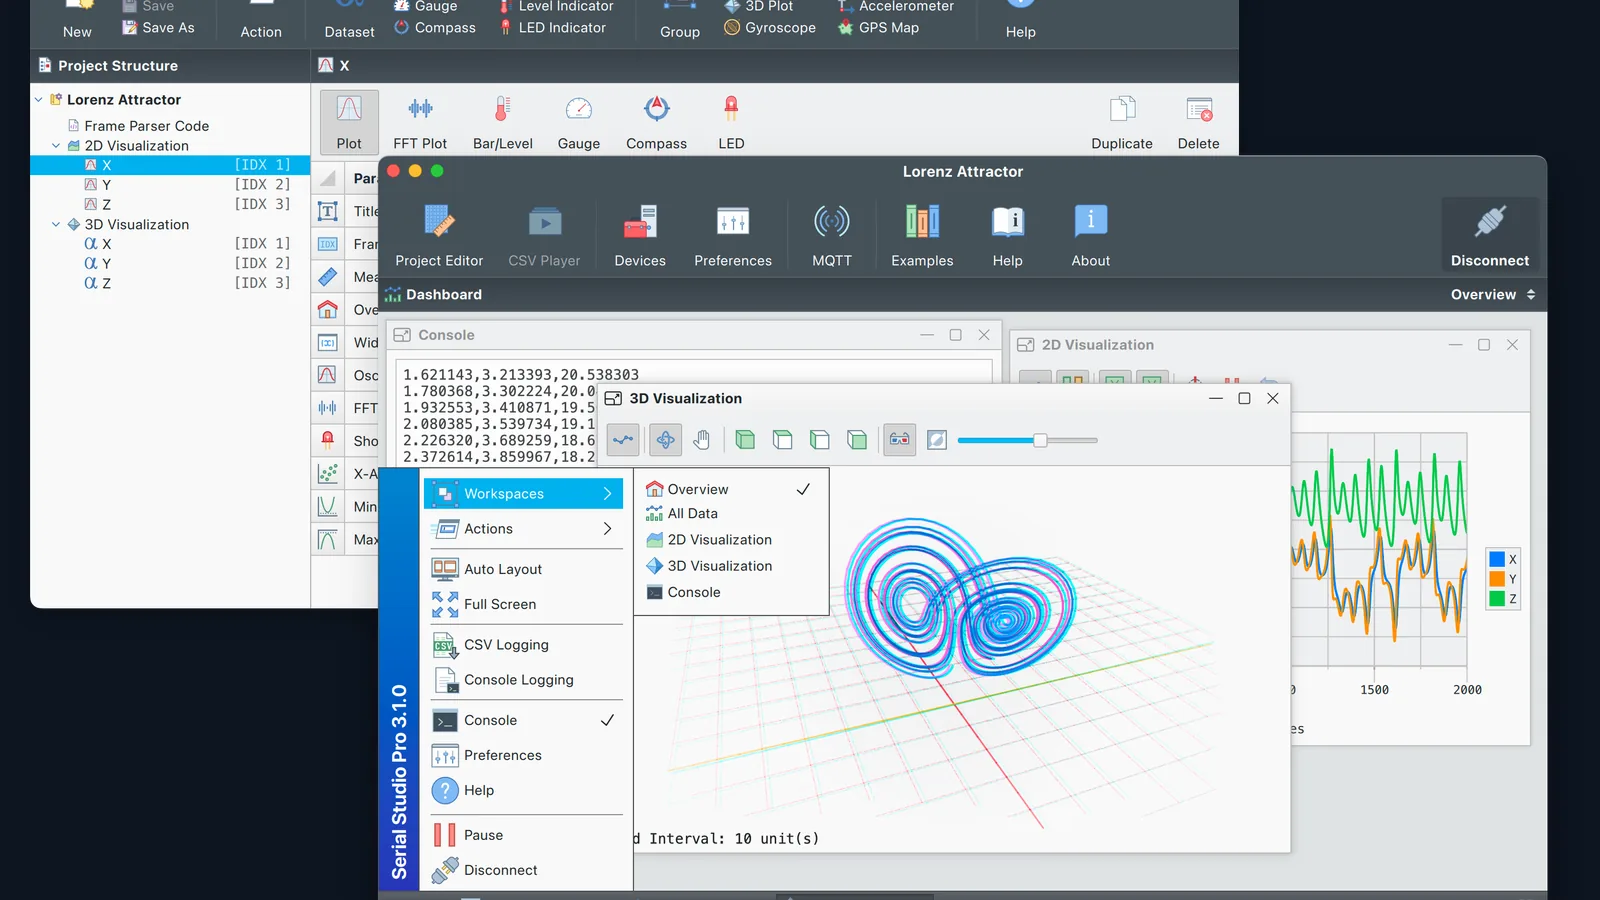
TL;DR: Serial Studio telemetry dashboard turns raw bytes from Arduino, ESP32, STM32, Raspberry Pi, and industrial buses into a live dashboard with plots, gauges, GPS maps, FFT, and 3D views, plus CSV logging and command-back controls. The GPL-3.0 core covers UART, Bluetooth LE, TCP, UDP, WebSocket, and HTTP with 17 widgets free forever on Windows, macOS, Linux, and Raspberry Pi. Pro adds MQTT, Modbus, CAN bus with DBC import, OPC UA, Siemens S7, EtherNet/IP, IEC 60870-5-104, audio, USB, HID, MDF4, SQLite session recording, PDF reports, and an AI project assistant. For hams it replaces four separate tools: serial monitor, serial plotter, GPS tracker map, and CSV logger, in one binary you can run on the bench PC and the field laptop.
What Serial Studio Is
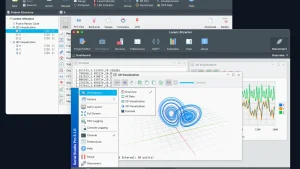
Serial Studio is a free open source telemetry dashboard that connects to a microcontroller, instrument, or industrial bus, decodes one user-defined data format, and renders live plots, gauges, maps, and 3D views around it while recording every frame for replay and export.
The project lives at https://github.com/Serial-Studio/Serial-Studio and ships official binaries from https://serial-studio.com/. It is developed and maintained by Alex Spataru, holds about 7,300 stars and 1,100 forks, and has more than 3,800 commits on master. The product site lists version 4.2.1 as current, with a 14-day Pro trial that starts the first time a Pro feature is used and falls back to the free tier instead of locking the user out.
Project Snapshot
| Item | Detail |
|---|---|
| Project | Serial Studio by Alex Spataru |
| License | Dual license: GPL-3.0-or-later core, commercial Pro modules and official binaries |
| Latest release | 4.2.1 (sealed deployment packages, ISA-18.1 alarm annunciator, trial on demand) |
| Stars and forks | About 7,300 stars, 1,100 forks, 133 watchers |
| Platforms | Windows 10 and 11, macOS 13 plus Universal, Linux x64 and ARM64, Raspberry Pi 4 and 5 64-bit |
| Engine | Native C++ on Qt 6.9 plus, 60 fps, parse pipeline benchmarked at 256,000 frames per second as a CI gate |
| Free drivers | Serial and UART, Bluetooth LE, TCP, UDP, WebSocket, HTTP |
| Pro drivers | MQTT with Sparkplug B, Modbus TCP and RTU, CAN bus, OPC UA, Siemens S7comm, EtherNet/IP, IEC 60870-5-104, audio input, raw USB libusb, HID hidapi, Process I/O |
| Free widgets | 17 including line plot, multi-plot, gauge, bar, compass, meter, GPS map, FFT, accelerometer, gyroscope, data grid, LED panel, terminal, web view, plus Clock and Stopwatch |
| Pro widgets | 3D Plot, Waterfall spectrogram, Image View live camera, Canvas scripted widget, output buttons, sliders, knobs, Output Panel, Notification Log |
| Scripting | Built-In form parsers, JavaScript, LuaJIT 2.1 with 5.1 syntax, 28 protocol templates |
| Recording | CSV in free build, MDF4 read and write, SQLite Historian, HTML and PDF session reports in Pro |
| Automation | TCP API with 360 plus commands on port 7777, gRPC server on port 8888, MCP server for Claude Desktop |
| Links | GitHub repo, product site, help center, releases, pricing |
Why the Arduino Serial Plotter Is Not Enough
Every Arduino and ESP32 builder knows the default loop. Open the Arduino IDE Serial Monitor to see numbers scroll. Open the Serial Plotter to see one wobbly line. Open a terminal like PuTTY or minicom to log to a file. Open Excel or Python later to make a chart anyone would believe. Four tools, four windows, zero memory of what the test meant a week later.
That stack breaks down the moment the project grows past one sensor. The IDE plotter draws every column the same color with no units, no gauges, and no map. PuTTY logs bytes but understands nothing inside them. MATLAB, LabVIEW, and Grafana understand everything but demand licenses, servers, and setup days. Industrial SCADA understands PLCs but has no interest in a ten-dollar ESP32 on a breadboard.
Serial Studio sits in the gap. One project file describes the frame format once. The same binary draws the dashboard, logs synchronized CSV, replays the session later through the same widgets, and sends commands back over the same cable. The free build already covers the whole hobby bench. The Pro modules extend the same pipeline to the factory floor without changing how the app feels.
How It Works: Six Stages, One Pipeline
Every device flows through the same six stages, documented in the official data flow reference. Learning this order makes every later feature obvious.
1. Connect
The driver receives raw bytes. In the free build that means UART serial, Bluetooth LE GATT notifications, or a network socket over TCP, UDP, WebSocket, or HTTP. Pro adds the industrial and media transports listed in the snapshot table.
2. Detect frames
The Frame Reader finds each frame in the byte stream. Optional start and end sequences plus CRC validation catch corrupted data before it ever reaches the screen, which matters on noisy RF links and long RS-485 runs.
3. Parse frames
Quick Plot mode splits comma, semicolon, tab, space, or name-colon-value lines automatically with no project at all. Project mode runs a parser: a Built-In template configured through a form, or a JavaScript or Lua parse() function for binary protocols, checksums, and packed bitfields.
4. Populate widgets
Dataset values flow into widgets. A plot shows history, a gauge shows now, a GPS map shows where, a data grid shows exact numbers, an LED panel shows status bits. One dataset can feed several widgets at once.
5. Record
In parallel, every frame is written to disk. CSV in the free build. SQLite session database and MDF4 in Pro. Recording never slows the live view because it runs on its own path.
6. Replay and export
Open any recording back through the same dashboard. Scrub the timeline, compare runs, and export a styled HTML or PDF session report with interactive charts when the test is ready to share or sign.
Connect to Anything: The 14 Drivers
The driver list is the clearest free versus Pro boundary, so read it before planning a project.
| Driver | Edition | What it talks to |
|---|---|---|
| UART and Serial | Free, GPL | USB-UART, RS-232, RS-485, TTL from Arduino, ESP32, STM32, Teensy, Raspberry Pi |
| Bluetooth LE | Free, GPL | GATT peripherals, sensor tags, wireless loggers |
| TCP and UDP | Free, GPL | Unicast, broadcast, multicast streams from any host |
| WebSocket and HTTP | Free, GPL | Web dashboards, REST pollers, simple bridges |
| MQTT with Sparkplug B | Pro | Any broker, TLS and auth, host or edge-node roles |
| Modbus TCP and RTU | Pro | Holding, input, coil, discrete registers, vendor CSV, XML, JSON map import |
| CAN bus | Pro | Classic CAN and CAN FD, DBC import, J1939 and ISO-TP reassembly |
| OPC UA | Pro | Browse address space, tick tags, signed and encrypted sessions |
| Siemens S7comm | Pro | S7-300, S7-400, S7-1200, S7-1500 by absolute address over ISO-on-TCP, read-only |
| EtherNet/IP | Pro | Allen-Bradley ControlLogix, CompactLogix, MicroLogix, Micro800, SLC 500, PLC-5 plus Omron NJ and NX by tag name, read-only |
| IEC 60870-5-104 | Pro | RTUs and substation gateways, general interrogation then spontaneous reports, read-only |
| Audio input | Pro | Any sound card as multichannel oscilloscope, FFT, or waterfall |
| Raw USB and HID | Pro | libusb bulk and isochronous endpoints, hidapi gamepads and custom devices |
| Process I/O | Pro | Spawn a script and pipe stdout, or read a named pipe from Python or Rust |
Three details matter for bench users. First, the three PLC drivers are read-only clients, so connecting Serial Studio to a running machine can’t change its state. Second, several Pro drivers ship with simulators, so OPC UA, Modbus, S7, IEC 104, and Sparkplug can be evaluated with no hardware on the desk. Third, multi-device projects, where each source keeps its own protocol, are a Pro feature, while one device at a time is free without limit.
Visualize Everything: 20 Plus Widgets
The free build ships 17 widgets, and Pro adds the rest past 20. Four of them deserve special attention because they behave differently from what newcomers expect.
Bar, Gauge, Compass, and Meter each render as a two-page swipe view. Page zero is the analog face for glanceable trend. Page one is a large digital readout for the exact value. One tile therefore covers both the across-the-room check and the write-it-in-the-logbook number.
The headline widgets group naturally:
- Time and spectrum: line plot, multi-channel plot, FFT spectrum, Waterfall spectrogram in Pro, XY scope patterns through the Canvas widget in Pro.
- State at a glance: gauge, bar, meter, compass, LED panel, data grid, bar panel.
- Motion and position: GPS map with OpenStreetMap tiles, accelerometer, gyroscope, 3D Plot in Pro.
- Text and web: terminal console with VT-100 and ANSI color, Quick Plot console, web view for embedding pages, Clock and Stopwatch utilities.
- Media and custom: Image View live JPEG or PNG camera stream in Pro, Canvas widget in Pro driven by a JavaScript
paint(ctx, w, h)callback with 18 templates including oscilloscope, polar plot, artificial horizon, audio VU, dial gauge, heatmap, vector field, and sparklines. - Command back: buttons, toggles, sliders, knobs, text fields, and freeform Output Panel in Pro, with templates that emit GCode, SCPI, Modbus, NMEA, and CAN frames on demand or on a timer.
Custom workspaces, also Pro, split large projects into focused tabs with a searchable taskbar, which is how a 200-dataset factory project stays navigable.
Parse and Transform Without Losing the Raw Data
Parsing is where Serial Studio earns its keep over a dumb plotter, and it offers three levels.
Built-In templates are compiled C++ parsers configured through a form. Delimited text, key-value pairs, JSON, NMEA, Modbus, and TLV shapes need no code at all, and this is the default for new projects.
JavaScript and Lua parsers handle everything else. A short parse() function receives the raw frame bytes and returns datasets, so MAVLink, UBX, SiRF, RTCM, MessagePack, COBS, SLIP, YAML, INI, and custom binary checksums all decode the same way. Twenty-eight script templates ship in the box as starting points, and existing protocol code can usually be pasted in with small edits. Lua runs on LuaJIT 2.1 with 5.1 syntax and compatibility shims.
Per-dataset transforms, a Pro feature, run every frame as short JS or Lua snippets for EMA smoothing, scaling, calibration coefficients, and unit conversion. Variables act as a shared bus so transforms can derive computed datasets from each other, and Data Tables hold constants and system values in one place. Every session keeps both the raw and the computed values, which is the traceability auditors and lab notebooks demand. Restore the project months later and the readings still match.
Record, Replay, Report, Transfer
Logging is split by edition, and the split is honest about who needs what.
CSV export in the free build writes every frame, ready for Excel, Python, MATLAB, or R. That alone replaces most bench logging.
Pro adds the formats professionals get asked for. MDF4 import and export covers CAN bus, LIN, FlexRay, and analog with files that open in CANalyzer, MATLAB, or Python. The Historian records frames and raw bytes into SQLite, then the Database Explorer browses, tags, exports, and replays full sessions. Session reports export a styled HTML or PDF with interactive Chart.js plots, which is the shortest path from a test run to a signed document. File transfer over the active connection speaks plain text, raw binary, XMODEM, YMODEM, and ZMODEM with CRC and resume, so firmware images and config files go to the device from the same console. A live InfluxDB 2.x sink streams every frame as line protocol for teams that already run a time-series stack.
Automate It: TCP API, gRPC, MCP, AI Assistant
Three machine interfaces expose the same control surface, plus one human-facing AI panel.
The TCP API on port 7777 offers more than 360 JSON commands for programmatic control, with a working API client example in the repo. The gRPC server on port 8888 mirrors the same command set over protobuf with live frame and raw-data streaming, documented in the official gRPC reference. An MCP server wraps the full surface for the Model Context Protocol, so Claude Desktop or any MCP host can drive Serial Studio, with a client example included.
The AI Assistant panel, a Pro feature, is a bring-your-own-key chat that edits the project file: sources, datasets, parsers, transforms, output widgets, and workspaces. Eight providers are supported: Anthropic, OpenAI, Google Gemini, DeepSeek, Groq, Mistral, OpenRouter, and local OpenAI-compatible endpoints such as Ollama, llama.cpp, LM Studio, and vLLM for fully offline use. Mutating actions show an Approve or Deny card first, and connection control plus device writes stay blocked until the Allow device control toggle is enabled as an Always-confirm action. Operator deployments hide the panel entirely.
Quick Start: Five Minutes from Zero to Plots
The official getting started guide covers the same path. This is the short version that works on any OS.
- Download the build for the bench PC from the latest release. Windows runs an MSI installer, macOS drags a Universal DMG into Applications, Linux makes the AppImage executable and runs it, Raspberry Pi uses the ARM64 AppImage on a 64-bit OS.
- Flash a two-sensor sketch to an Arduino Uno or any ESP32. The classic example prints two comma-separated values per line at 10 Hz.
- Open Serial Studio, pick the serial port and baud rate, and click Connect.
- Enable Quick Plot. Two traces appear with no project file at all.
- When ready, open the Project Editor, define one group with two datasets, attach a line plot plus a gauge and a data grid, save the project, and reconnect through it.
void setup() {
  Serial.begin(115200);
}

void loop() {
  int temperature = analogRead(A0);
  int humidity = analogRead(A1);
  Serial.print(temperature);
  Serial.print(",");
  Serial.println(humidity);
  delay(100);
}
Upload, select 115200 baud in Serial Studio, enable Quick Plot, and both channels draw immediately. Change the delay to 20 ms and watch the throughput headroom: the parse pipeline is CI-gated at 256,000 frames per second, so a 50 Hz bench stream is effectively idle.
Linux users have two extra options. The AppImage runs anywhere from the Debian 10 and RHEL 8 generation onward with its own bundled glibc, and Flathub carries a regularly updated Flatpak that tends to behave better on ARM64. On Wayland desktops expect the occasional missing window shadow, a known cosmetic quirk.
Serial Studio Compared with the Usual Tools
| Tool | Cost | Inputs | Dashboard | Logging | Command back | Best for |
|---|---|---|---|---|---|---|
| Serial Studio free | Free, GPL-3.0 | UART, BLE, TCP, UDP, WebSocket, HTTP | 17 widgets, maps, FFT | CSV, replay | No | Bench telemetry with zero setup |
| Serial Studio Pro | Paid license, 14-day trial | Plus MQTT, Modbus, CAN, OPC UA, S7, EtherNet/IP, IEC 104, audio, USB, HID | Plus 3D, waterfall, camera, Canvas, outputs | Plus MDF4, SQLite Historian, PDF reports | Yes, buttons and sliders | Lab, automotive, factory floor |
| Arduino IDE Serial Plotter | Free | USB serial only | Single multi-line plot | None | No | First-blink sanity check |
| PuTTY, Tera Term, minicom | Free | Serial, SSH, Telnet | None, text only | Raw text capture | Manual typing | Console access and AT commands |
| Processing sketches | Free, code | Serial, network | Hand-built 2D | Hand-built | Hand-built | Custom one-off visualizers |
| MATLAB and LabVIEW | Licensed, costly | Broad with toolboxes | Full engineering plots | Full test management | Full | Funded labs and production test |
| Grafana plus broker | Free, server | MQTT and databases | Web dashboards | Time-series DB | Via plugins | Fleet dashboards, not bench debug |
The pattern is consistent. Serial Studio wins when one engineer needs a real dashboard this afternoon with no server, no license ticket, and no custom GUI code. It loses when the job is fleet monitoring across months, where Grafana and a database are the right answer, or when certification demands LabVIEW test management.
How Amateur Radio Operators Can Use It
Serial Studio isn’t a ham radio program, but it speaks every protocol a ham bench produces. Each pattern below maps to real operating, building, or training.
1. ESP32 shack sensor node in an afternoon
Point an ESP32 at the shack: DHT22 temperature and humidity, BMP280 pressure, a current sensor on the 13.8 V supply, and an SWR bridge voltage. Print one CSV line per second over USB serial. Serial Studio draws temperature and voltage plots, a humidity gauge, and a data grid with exact values, all logging to CSV. Add per-dataset transforms in Pro to convert raw ADC counts to volts and degrees with calibration constants in a Data Table.
2. APRS tracker and GPS receiver debugging
Most APRS firmware emits NMEA sentences during development. Feed the GPS UART through Serial Studio with the NMEA template parser, and latitude, longitude, speed, and fix quality land on the GPS map plus a data grid. Corrupted sentences fail CRC at the Frame Reader instead of teleporting the map marker to the wrong continent. The same setup debugs any LoRa tracker that prints callsign,lat,lon,alt,batt lines during bench testing.
3. MAVLink drone and balloon telemetry ground station
Start from the MAVLink script template, connect over TCP to a SiK radio bridge or a serial link, and decode attitude, altitude, battery, and GPS with no custom code. Pin the GPS map beside the accelerometer and gyroscope widgets, add the Image View in Pro for the payload camera, and record the whole flight to SQLite for the debrief PDF. CanSat and CubeSat teams use exactly this shape.
4. Antenna analyzer sweep visualizer
Drive a sweep from an Arduino or NanoVNA-style bridge that prints frequency,swr,r, x lines, and Serial Studio draws the SWR curve as a live multi-plot while a gauge shows present SWR and an LED panel flags the 2:1 threshold. Record each antenna, replay A versus B through the same dashboard, and the comparison is honest because the widgets never changed.
5. Rotator, amplifier, and station automation console
Output widgets in Pro turn the dashboard into a control head. Buttons send Yaesu GS-232 rotator commands, sliders set amplifier drive, text fields issue SCPI to a lab supply, and the Control Loop setup() and loop() automation sends handshakes and polls registers without touching device firmware. The Operator deployment lock then gives the club station a read-only dashboard where visitors can’t reconfigure the connection.
6. EMC, audio, and power supply forensics
The Pro audio driver turns any USB sound card into a multichannel oscilloscope, FFT analyzer, or waterfall. Hunt switching-supply whine, check microphone audio spectra, or watch mains hum sidebands while a linear supply warms up, all beside the serial telemetry from the device under test. Session reports capture both for the article or the forum thread.
7. SOTA, POTA, and Field Day test bench
Run the Raspberry Pi ARM64 build on the same Pi that will go to the field. Validate the whole station on the bench: paddle keyer timing over serial, battery discharge curve over BLE, GPS lock on the map, all recorded to CSV. One project file moves between the home PC and the field laptop unchanged because projects are cross-platform.
Honest Limitations
No tool review is complete without the trade-offs. The free GPL build can’t create or edit per-dataset transforms, Variables tables, or custom workspaces, and a project containing them needs Pro to connect, although removing them is free. Multi-device projects, DBC and register-map importers, MDF4, Historian, PDF reports, file transfer, and the AI Assistant are all Pro-only. The official binaries require a Pro license for commercial use even though a source-built GPL binary carries no such restriction beyond the GPL itself. Builds need Qt 6.9 or later with a long module list plus a C++20 compiler, so compiling from source is heavier than apt install habits expect. The macOS Homebrew cask is community maintained and not officially tested. And Serial Studio is a dashboard, not a full SCADA historian: for months of fleet data, pair its InfluxDB sink or CSV exports with a real time-series database.
Pricing at the time of writing is a yearly or lifetime Pro license through the official store, with the free tier unlimited in time and the trial starting only on first Pro feature use. Check the pricing page before budgeting, because pricing moves.
Get Started
- Grab the build for the shack PC from the latest stable release or try nightly pre-release builds. Windows needs the Visual C++ Redistributable, macOS drags to Applications, Linux runs the AppImage.
- Work the five-minute path above with any Arduino or ESP32 and Quick Plot.
- Read the getting started guide, then the use cases and comparison pages for the 18-field tour from rocketry to factory automation.
- Browse
/examplesfor Arduino, ESP32, and Python sketches with matching sample projects. - File bugs and feature requests as GitHub issues. Commercial licensing goes to [email protected].
Sources and Further Reading
- Serial Studio GitHub repository, README, and source: https://github.com/Serial-Studio/Serial-Studio
- Serial Studio official site and feature tour: https://serial-studio.com/
- Serial Studio help center: https://serial-studio.com/help
- Serial Studio releases, stable and pre-release: https://github.com/Serial-Studio/Serial-Studio/releases
- Serial Studio pricing and Pro versus Free matrix: https://serial-studio.com/pricing
- Serial Studio API client example: https://github.com/Serial-Studio/Serial-Studio/tree/master/examples/API%20Test
- Serial Studio gRPC server reference: https://github.com/Serial-Studio/Serial-Studio/blob/master/doc/help/gRPC-Server.md
- Serial Studio MCP client example: https://github.com/Serial-Studio/Serial-Studio/tree/master/examples/MCP%20Client
- Serial Studio Pro versus Free feature matrix: https://github.com/Serial-Studio/Serial-Studio/blob/master/doc/help/Pro-vs-Free.md
- Serial Studio use cases across 18 fields: https://github.com/Serial-Studio/Serial-Studio/blob/master/doc/help/Use-Cases.md
- Flathub Serial Studio page: https://flathub.org/apps/com.serial_studio.Serial-Studio
- Qt 6 framework, the native engine under Serial Studio: https://www.qt.io/
73 de 9M2PJU. Print the CSV, draw the dashboard, keep the recording.

Post Comment